
The problem
More artificial light does not necessarily mean a plant can use it effectively. Temperature, humidity and other conditions can limit its response. This work explores how the plant’s own signals can help assess when additional light may be useful.
The approach
The approach combines plant-science expertise with analysis of plant and environmental data. My contribution covers the analytical logic and Grafana dashboards, refined through feedback on how clearly they communicate. These views help users assess the situation and decide what to investigate next.
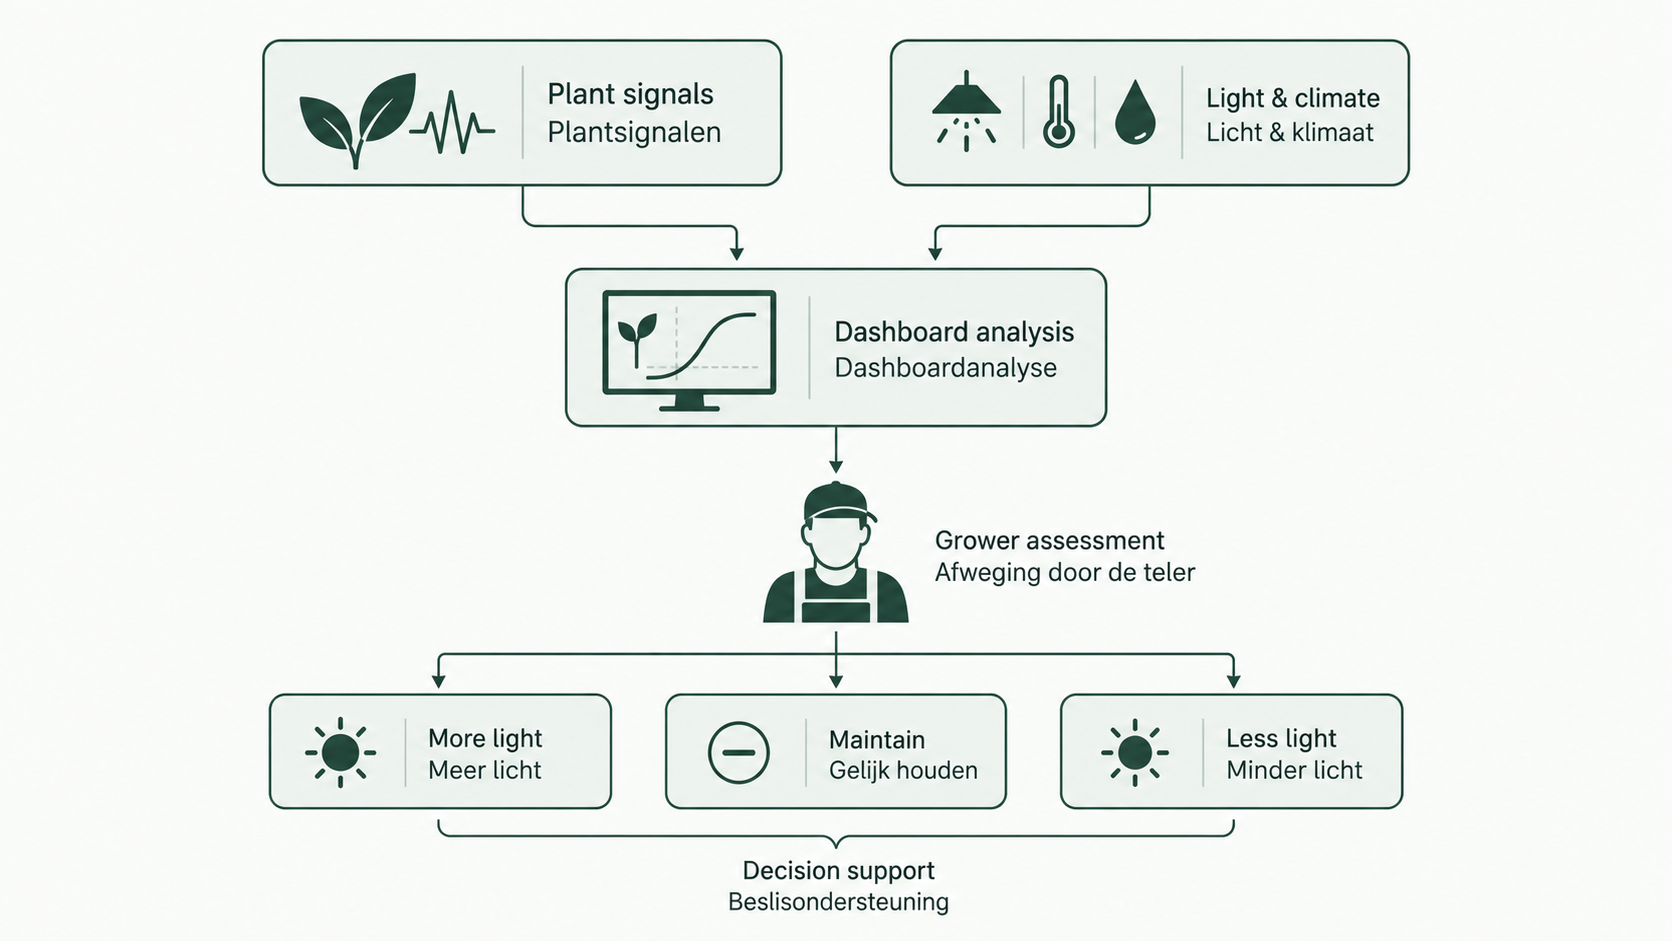
Text description of the infographic
Plant signals and conditions are analysed together. A grower uses the dashboard to consider more light, maintaining the current level or less light. The visual describes decision support; it does not show autonomous control.
The challenge
A dashboard needs to distinguish an observation from an interpretation. It should make a complex plant response understandable without suggesting that one signal proves what a grower should do.
Outcome & value
Decision-support concepts and dashboards for exploring whether additional light may help, whether climate could be limiting plant activity, and whether increasing, reducing or maintaining lighting warrants investigation. This work supports human decisions; it is not presented as autonomous greenhouse control.
Lessons learned
The analytical result and the way it is shown are part of the same product. Collaboration with domain specialists made both the reasoning and its limits clearer.
Evidence & artifacts
- WEBVivent Biosignals
Company context. Internal dashboards and implementation are not shared.
This case describes my contribution at a conceptual level. Internal data, code and dashboards remain within Vivent.