
The problem
Plant scientists needed a daily overview of active trials with connectivity or data-completeness issues. Finding those trials required manually checking monitoring dashboards. The goal was to bring the situations needing attention into the team’s existing Slack workflow.
The approach
A scheduled Python job queries internal source data, combines operational metadata with recent device status and aggregates the results at trial level. It selects trials needing attention and delivers a structured summary through the Slack API using Block Kit tables.
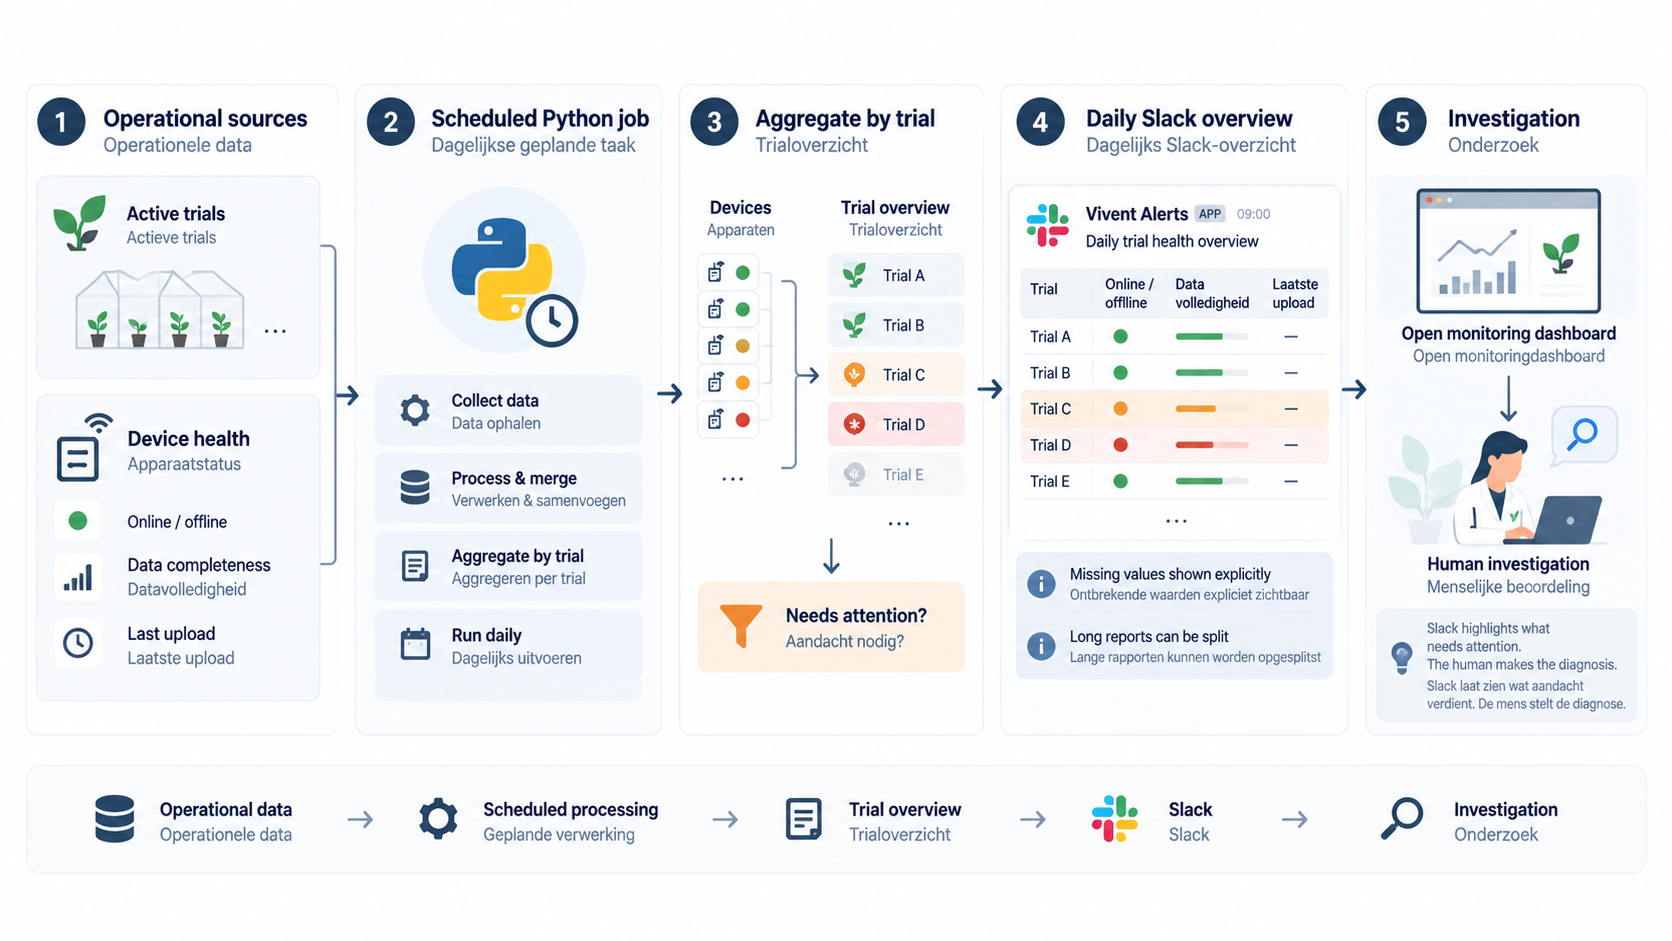
Text description of the infographic
Active-trial information and device health, including online status, data completeness and last upload, feed a scheduled daily Python job. The job combines data and aggregates by trial to surface situations needing attention. A Slack overview makes missing values explicit and can split long reports. Plant scientists open the monitoring dashboard to interpret and investigate the signals. The diagram is conceptual: placeholder rows and status indicators are examples, and the automation does not diagnose problems.
The challenge
The challenge was to turn device-level operational data into an overview that people could scan and act on, while keeping the scheduled job reliable as the amount of data increased. Missing data and supporting context also needed clear handling.
From operational data to action
The workflow combines metadata about active trials with recent device-health information, then aggregates it into a trial-level summary. I chose to query the underlying source data directly, giving the job its own testable filtering and aggregation logic. Dashboards serve as destinations for further investigation.
Designed for operational use
The summary prioritises trials needing attention and keeps the responsible plant scientist, trial context, online and offline device counts, data-completeness indicators and last-upload information together. A report timestamp and summary give readers context, while each trial links back to the internal monitoring environment. Missing values are represented explicitly and longer reports can be split across messages.
Reliability and performance
A supporting metadata lookup became a query-performance bottleneck. Replacing an expensive latest-value operation with a grouped aggregation improved runtime in read-only tests. The trade-off is that the displayed contextual value may differ from the most recently reported value. It is informational and does not affect the connectivity or data-completeness assessment; that limitation was documented explicitly.
Outcome & value
A repeatable daily overview of trials needing attention in the team’s existing workspace, with operational context and links for follow-up. The implementation brings together information that previously required manual dashboard checks and supports investigation of connectivity and data-completeness issues.
Lessons learned
Working from source data makes filtering, aggregation and testing easier to control. A useful operational summary also depends on clear prioritisation and a route to investigation. Performance improvements need explicit accuracy trade-offs, and a successful test run needs separate validation in the intended workflow.
This case describes my contribution at a conceptual level. Internal data, code and dashboards remain within Vivent.